

Futures Calculator
Use this tool to figure out what you could potentially make or lose on a trade.
Learn More
Futures Quotes & Charts
Our futures quotes and commodity charts include complete market data and enhanced features such as key technical numbers.
Learn More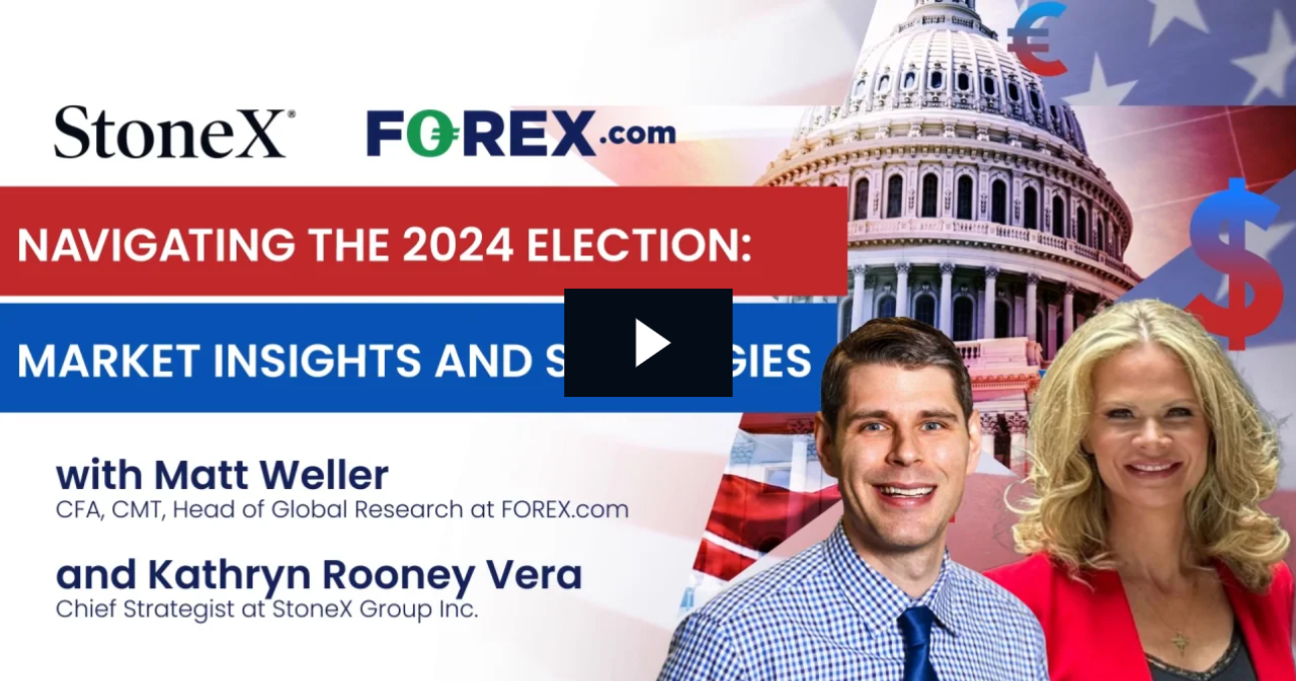
Navigating the 2024 Election: Market Insights and Strategies with Kathryn Rooney Vera
Gain valuable insights and strategies for navigating the 2024 election with an exclusive interview featuring Chief Market Strategist Kathryn Rooney Vera, and Head of Market Research Matt Weller.
Learn More
CME Group Resource Center
Whether you’re looking for new trading opportunities or a capital efficient way to manage portfolio risk, futures and options on futures offer a wide array of products to accomplish either objective. Start today by watching CME Group's top 5 reasons why traders come to the futures markets.
Learn More
Commitments of Traders Report Explanation
The Commitment-of-Traders (COT) reports can sometimes give traders a good idea of future significant moves in the market. The CFTC requires large speculators and commercial traders, or hedgers, to report their net positions twice each month.
Learn More
Webinar: Intro to Futures and Forex Trading
Discover the power of CME Group futures & Forex.com forex trading with experts from Forex.com and StoneX Financial Inc. Gain insights on trading fundamentals and tools. Watch the on-demand webinar now!
Learn More
Webinar: Navigating Market Shifts: Economic Events & CME Group Equity Index Options
Explore how to navigate market shifts with CME Group Equity Index Options in our webinar. Learn about how key economic events like reports and elections can impact the markets. Sign up now!
Learn More
Contracts Traded
Founded in 1898 as a not-for-profit corporation, in November 2000 CME became the first U.S. financial exchange to demutualize and become a shareholder-owned corporation. View information here to expand your knowledge.
Learn More
Expiration Months
View a brief introduction to CME’s hand signals. Anyone who works on the Exchange floors needs to know and use these signals perfectly. Hand signals are essential for successful pit trading at CME, and using the wrong signal could result in a substantial loss.
Learn More
Fundamental Analysis
Fundamental analysis is the study of the factors that affect supply and demand. The key to fundamental analysis is to gather and interpret this information and then to act before this information is incorporated into the futures price. This lag time between an event and its resulting market response presents a trading opportunity for the fundamentalist.
Learn More
Futures Contract
A futures contract is an agreement to buy or sell a commodity at a date in the future. Everything about a futures contract is standardized except its price. All of the terms under which the commodity, service or financial instrument is to be transferred are established before active trading begins, so neither side is hampered by ambiguity.
Learn More
Futures Exchange
Futures contracts are traded at a futures exchange and only at a futures exchange. Chicago Mercantile Exchange (CME), like the other exchanges in the U.S., provides a place to trade, formulates rules for trading and supervises trading practices. There are currently eight futures exchanges in the U.S.
Learn More
GLOBEX
GLOBEX is Chicago Mercantile Exchange’s global electronic trading system. The system offers computerized order entry and trade matching on a wide range of futures and options products, virtually 24 hours a day, to people around the world.
Learn More
Hand Signals
Hand signals – the sign language of futures trading — represent a unique system of communication that effectively conveys the basic information needed to conduct business on the trading floor.
Learn More
Hedgers & Speculators
Speculators are people who analyze and forecast futures price movement, trading contracts with the hope of making a profit. The producers and users of commodities who use the futures market are called hedgers.
Learn More
Options on Futures
Options on futures were introduced in the 1980s. An option contract allows you the right, but not the obligation, to buy or sell an underlying futures contract at a particular price. View information here to expand your knowledge.
Learn More
Orders in the Pit
A futures brokerage firm (“house”) that is a member of Chicago Mercantile Exchange (CME) places orders to buy or sell futures or options contracts for companies or individuals and earns a commission on each transaction. Everyone who trades futures and options on futures contracts must have an account with a futures brokerage house, which is officially called Futures Commission Merchant (FCM).
Learn More
Reading Quotes
Futures prices are published for every trading session, and previous day prices are reported daily in major newspapers such as The Wall Street Journal (Section 2). You can also get prices for contracts traded at CME on the CME web site www.cmegroup.com and from a number of different quote vendors.
Learn More
Supply and Demand
The price of a product or a commodity depends on the relationship between supply and demand. If the supply and demand curves are placed on the same graph, the point where they intersect is the product’s market price. Based on all the supply and demand factors, this is the price discovered as people buy and sell the commodity or trade futures.
Learn More
Technical Analysis
This approach to price prediction is based on the premise that price movements follow consistent historical patterns. Those who engage in technical analysis study charts or statistics that measure price movements and try to find repetitive patterns.
Learn More
Trading Pit
Even though more and more futures contracts are being traded online, there’s still plenty of action in the trading pits at Chicago Mercantile Exchange (CME) and other U.S. exchanges. That’s where traders determine futures prices, which change from minute to minute as trading goes on.
Learn More
Risk Management
Risk management and financial surveillance are the two primary functions of CME’s financial safeguard system. The system is designed to provide the highest level of safety and the early detection of unsound financial practice on the part of any clearing member.
Learn More.png)
Futures and Options Strategy Guide
The strategies in this futures options strategy guide are not intended to provide a complete guide to every possible trading strategy.
Learn More.png)
Futures & Options Strategies: Bear Spread
Use this if you think the market will go down, but with limited downside. Good position if you want to be in the market but are less confident of bearish expectations.
Learn More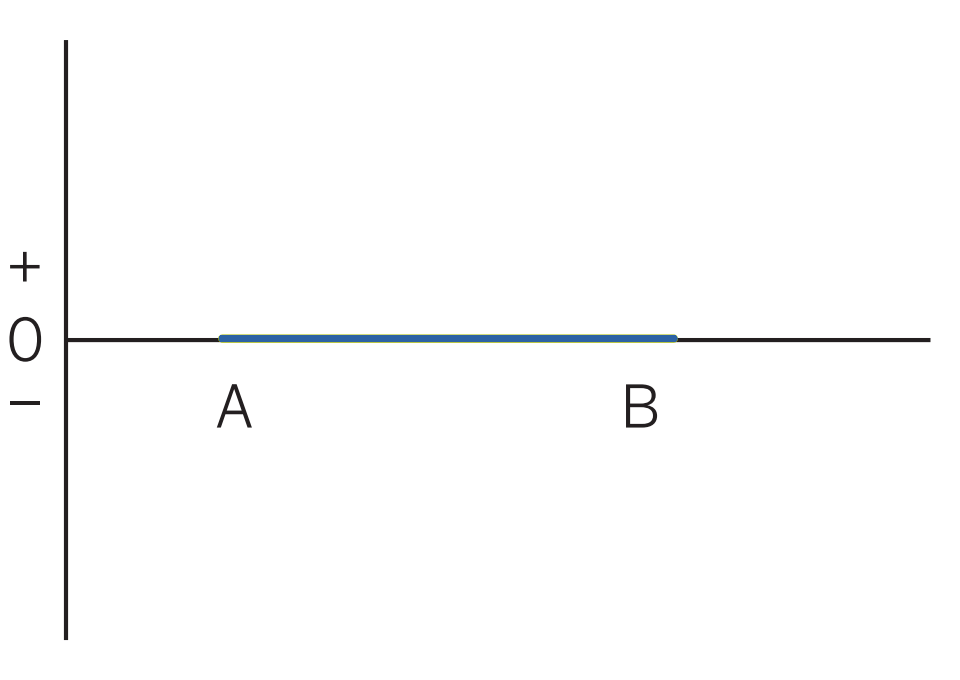
Futures & Options Strategies: Box or Conversion
Occasionally, a market will get out of line enough to justify an initial entry into one of these positions. However, they are most commonly used to “lock” all or part of a portfolio by buying or selling to create the missing “legs” of the position.
Learn More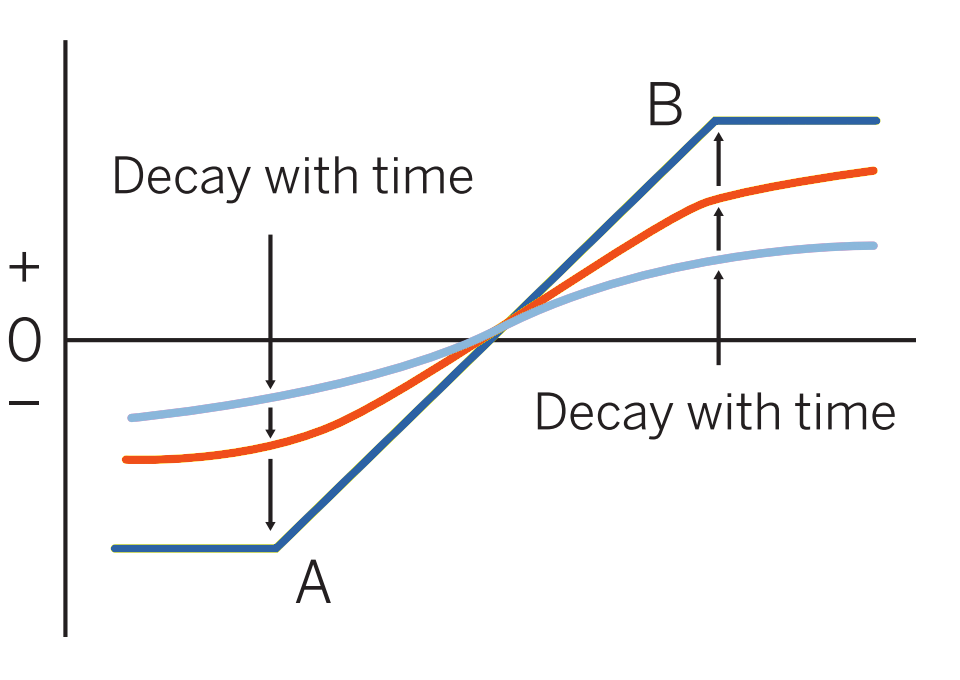
Futures & Options Strategies: Bull Spread
Use this strategy if you think the market will go up, but with limited upside. Good position if you want to be in the market but are less confident of bullish expectations.
Learn More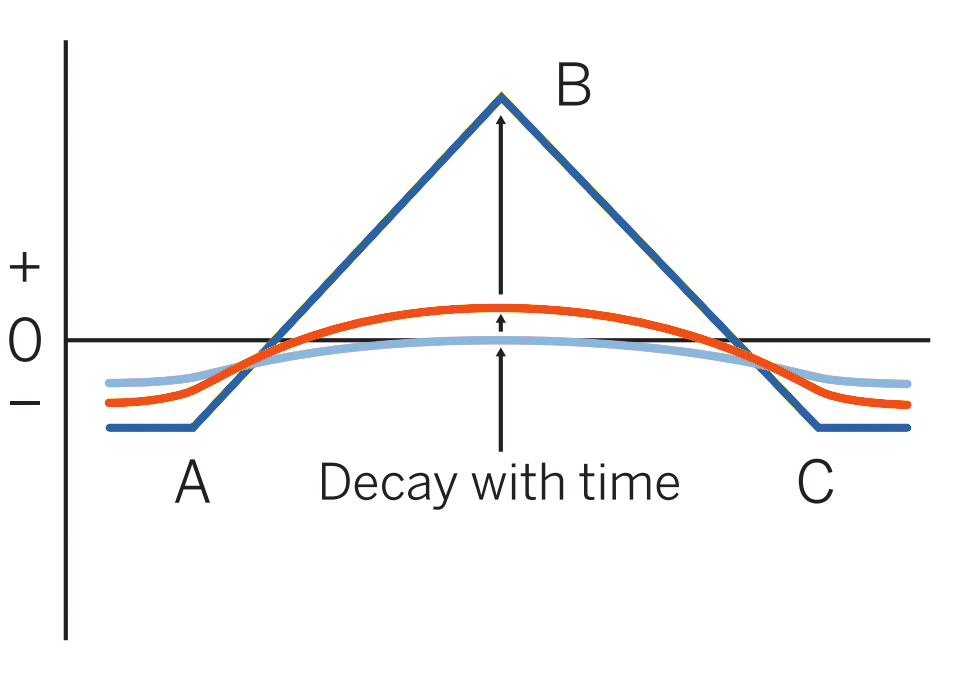
Futures & Options Strategies: Long Butterfly
One of the few positions which may be entered advantageously in a long-term options series. Enter when, with one month or more to go, cost of the spread is 10 percent or less of B – A (20 percent if a strike exists between A and B).
Learn More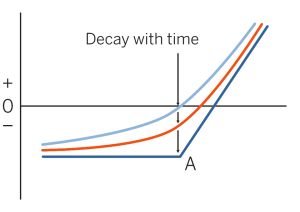
Futures & Options Strategies: Long Call
Use this strategy when you are bullish to very bullish on the market. In general, the more out-of-the-money (higher strike) calls, the more bullish the strategy.
Learn More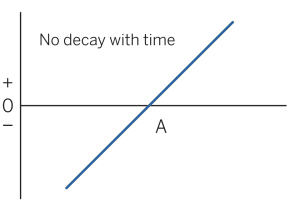
Futures & Options Strategies: Long Futures Trading Strategy Guide
Long futures positions may make sense when you are bullish on the market and uncertain about volatility. You will not be affected by volatility changing.
Learn More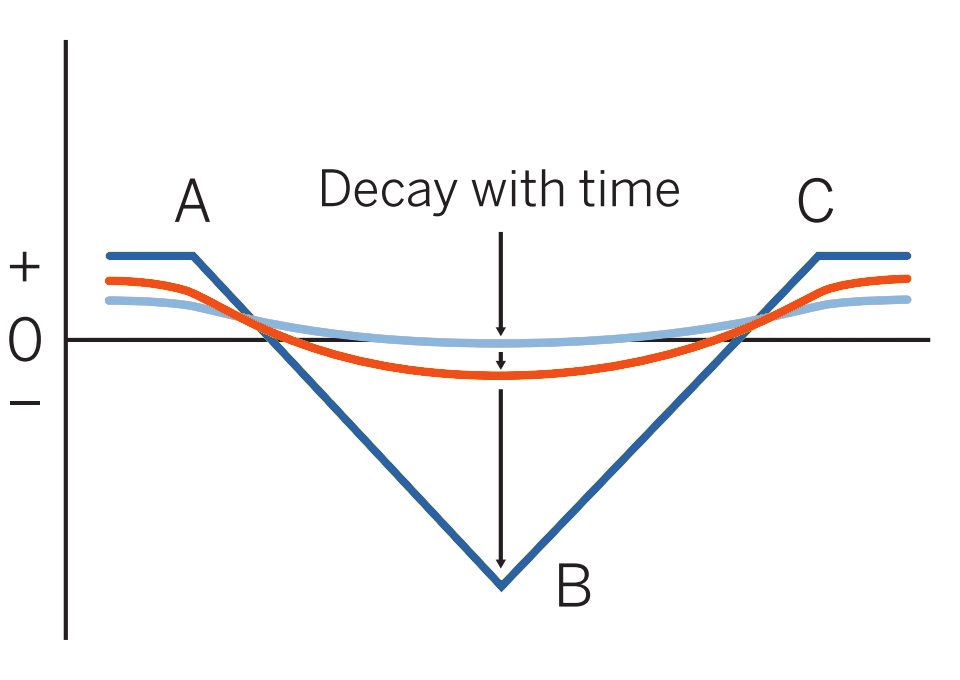
Futures & Options Strategies: Long Iron Butterfly
This strategy is best for traders who anticipate very little price movement in the underlying asset and want to profit from low volatility conditions by collecting premium income from selling options, while also limiting potential losses through the purchase of options at wider strike prices.
Learn More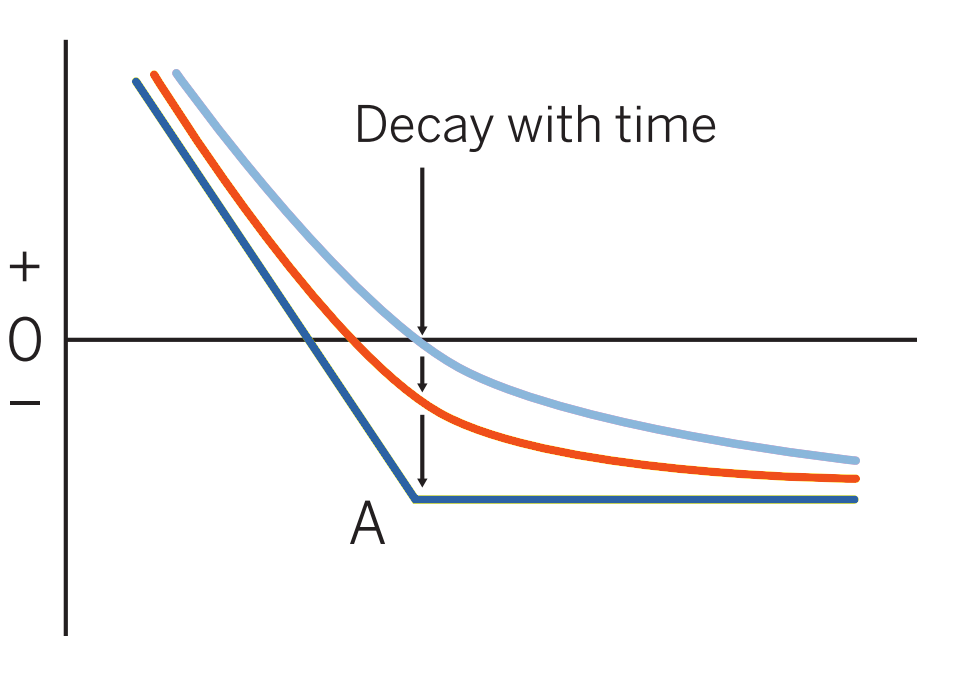
Futures & Options Strategies: Long Put Options Trading Strategy
Long put options may be a strategy to consider when you are bearish to very bearish on the market. Profit increases as markets fall.
Learn More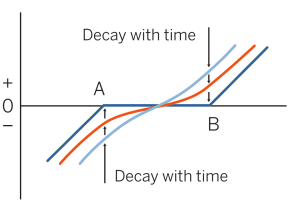
Futures & Options Strategies: Long Risk Reversal
When you are bullish on the market and uncertain about volatility. Normally this position is initiated as a follow-up to another strategy. Its risk/reward is the same as a LONG FUTURES except that there is a flat area of little or no gain/loss.
Learn More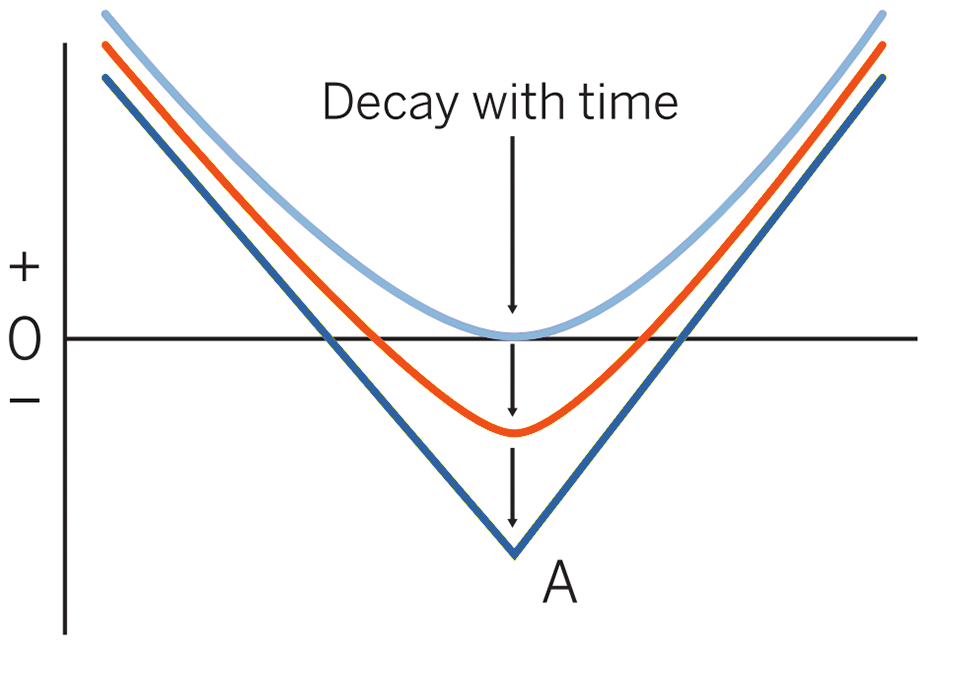
Futures & Options Strategies: Long Straddle Pattern
This trader looks at the low implied volatility and feels that options are relatively inexpensive. The expectation is the market is poised for a big move
Learn More.png)
Futures & Options Strategies: Long Strangle
If market is within or near (A-B) range and has been stagnant. If market explodes either way, you make money; if market continues to stagnate, you lose less than with a long straddle. Also useful if implied volatility is expected to increase.
Learn More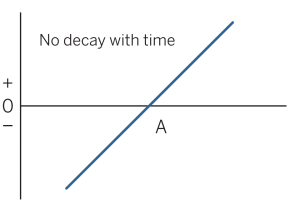
Futures & Options Strategies: Long Synthetic Futures
When you are bullish on the market and uncertain about volatility. You will not be affected by volatility changing. However, if you have an opinion on volatility and that opinion turns out to be correct, one of the other strategies may have greater profit potential and/or less risk. May be traded into from initial long call or short put position to create a stronger bullish position.
Learn More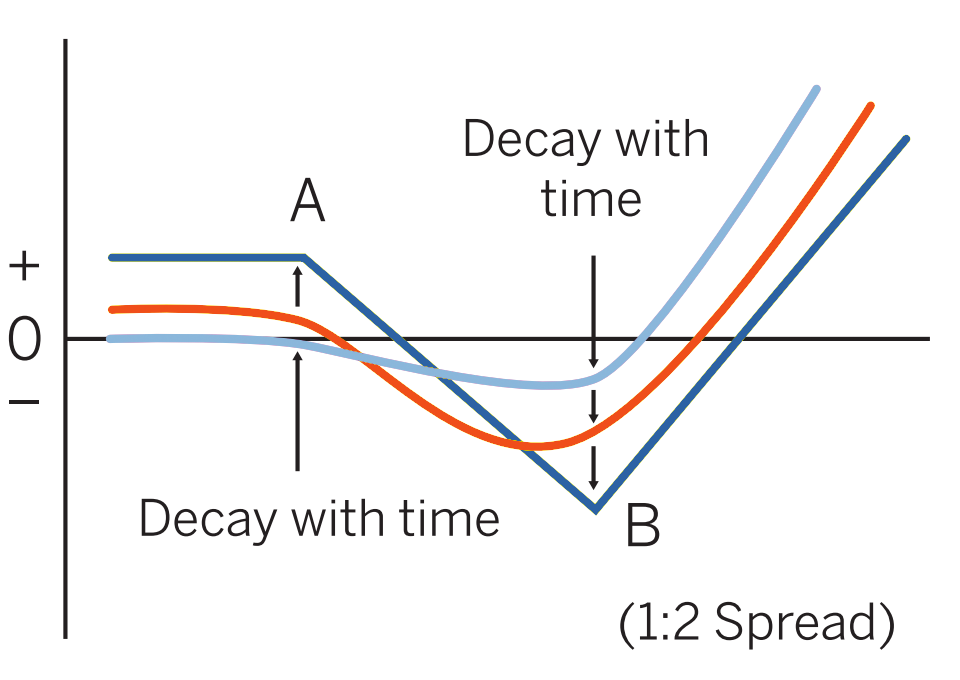
Futures & Options Strategies: Ratio Call Backspread
Normally entered when market is near B and shows signs of increasing activity, with greater probability to upside.
Learn More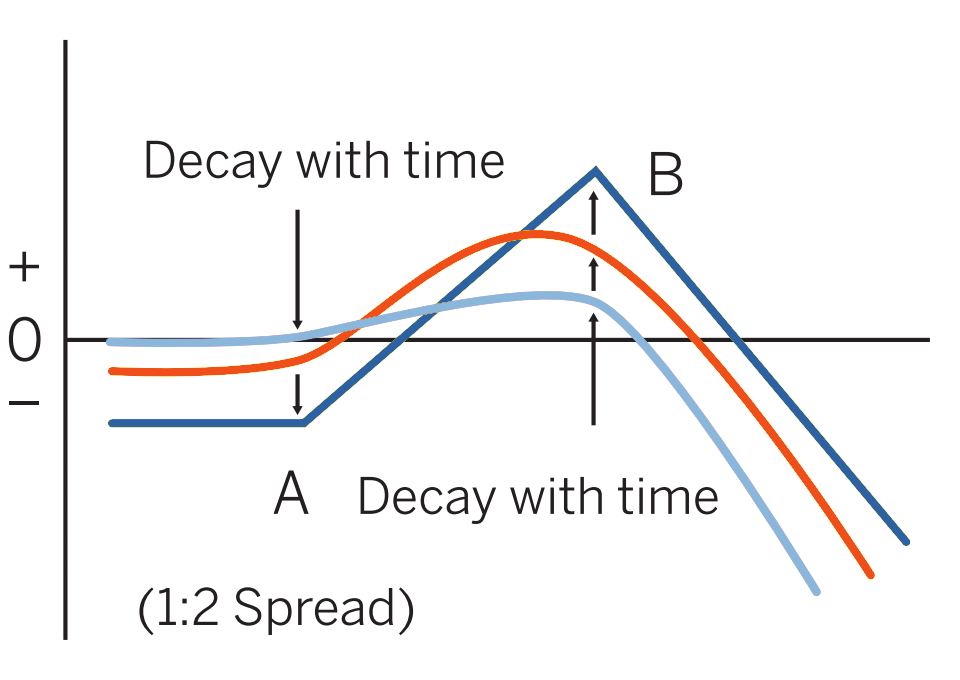
Futures & Options Strategies: Ratio Call Spread
Usually entered when market is near A and user expects a slight to moderate rise in market but sees a potential for sell-off. One of the most common option spreads, seldom done more than 1:3 (two excess shorts) because of upside risk.
Learn More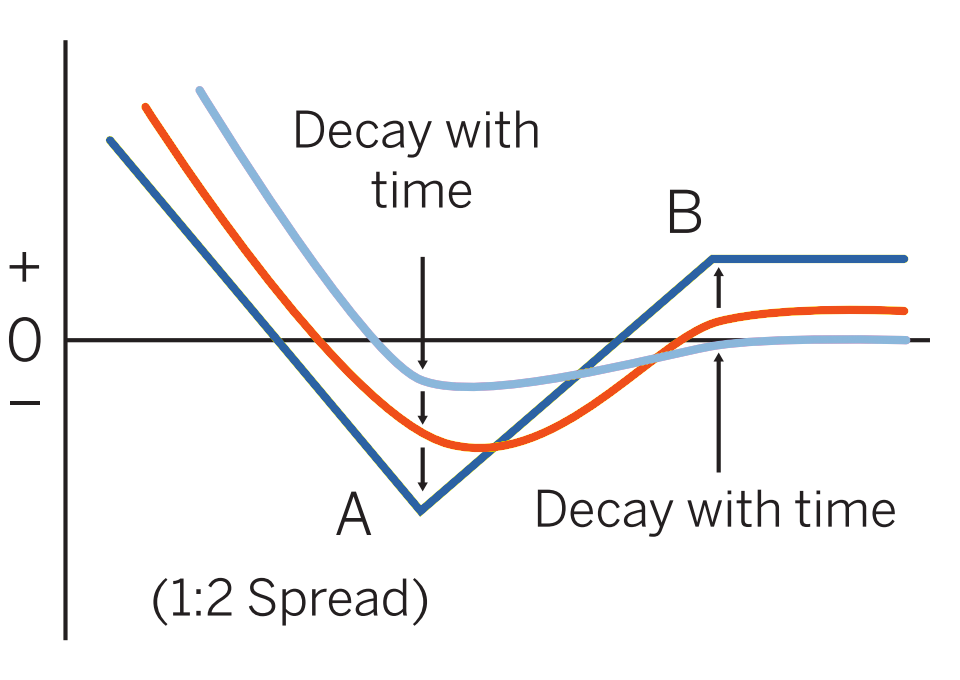
Futures & Options Strategies: Ratio Put Backspread
Normally entered when market is near A and shows signs of increasing activity, with greater probability to downside (for example, if last major move was up, followed by stagnation).
Learn More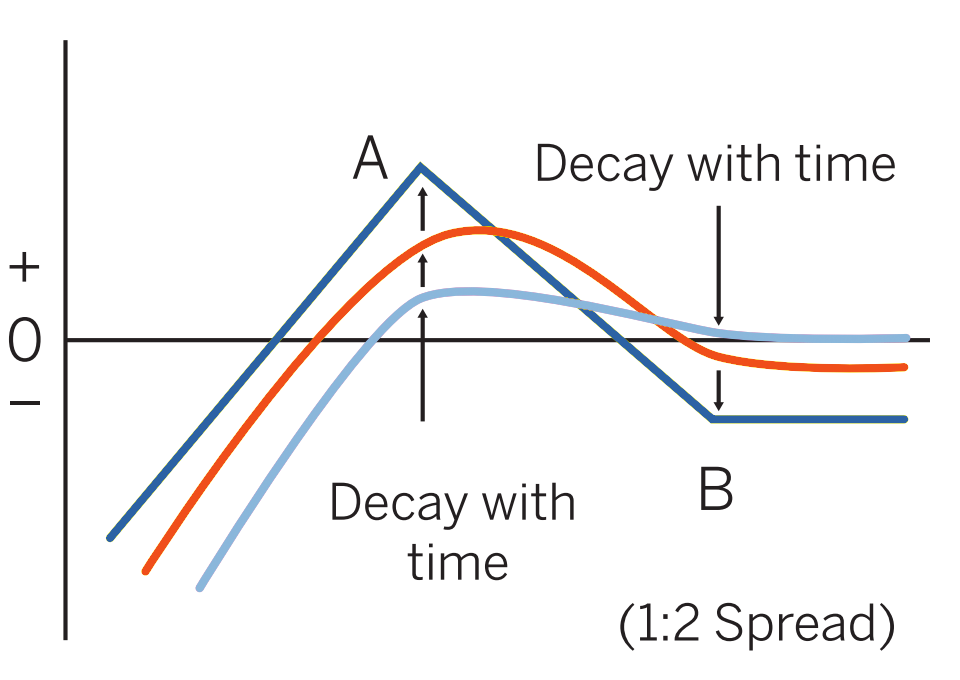
Futures & Options Strategies: Ratio Put Spread
Usually entered when market is near B and you expect market to fall slightly to moderately, but see a potential for sharp rise. One of the most common option spreads, seldom done more than 1:3 (two excess shorts) because of downside risk.
Learn More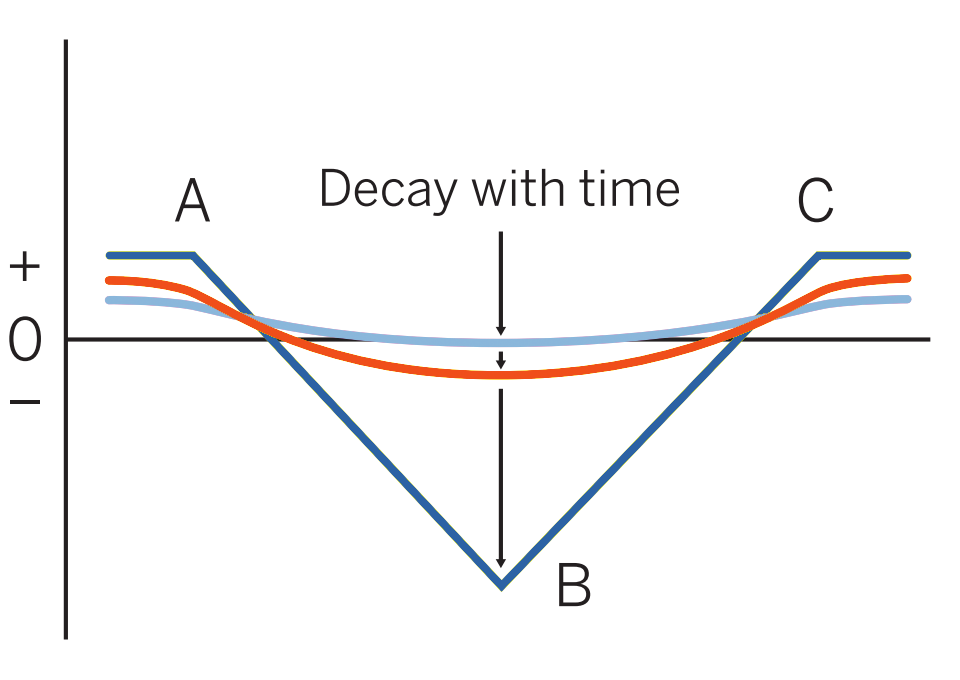
Futures & Options Strategies: Short Butterfly
When the market is either below A or above C and position is overpriced with a month or so left. Or when only a few weeks are left, market is near B, and you expect an imminent move in either direction.
Learn More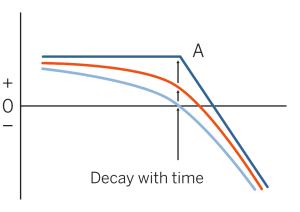
Futures & Options Strategies: Short Call
When you are bearish on the market. Sell out- of-the-money (higher strike) puts if you are less confident the market will fall, sell at-the-money puts if you are confident the market will stagnate or fall.
Learn More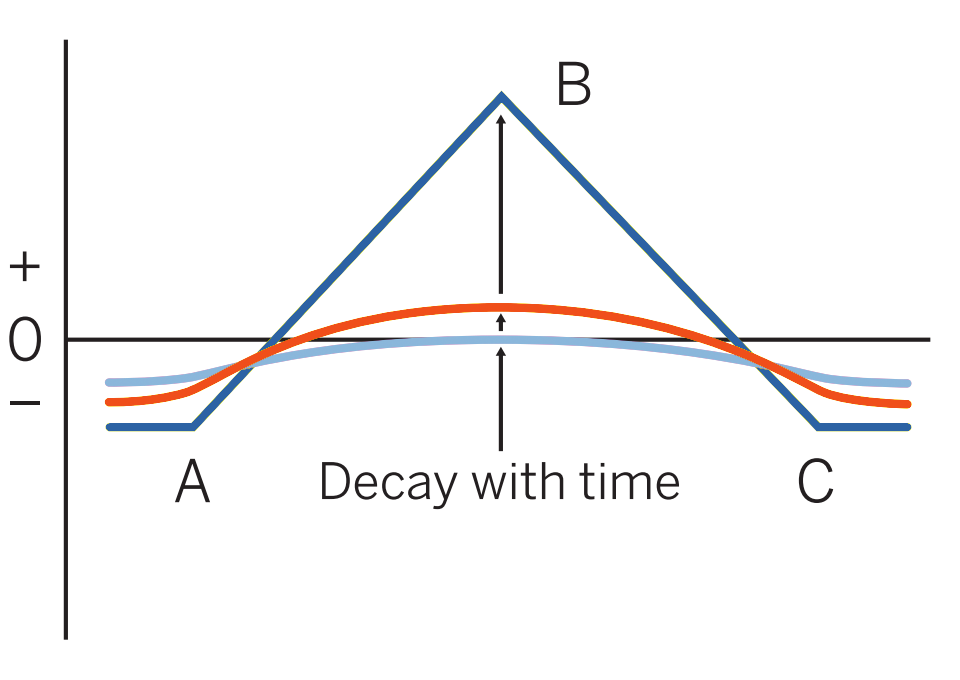
Futures & Options Strategies: Short Iron Butterfly
Enter when the Short Iron Butterfly’s net credit is 80 percent or more of C – A, and you anticipate a prolonged period of relative price stability where the underlying will be near the mid-point of the C – A range close to expiration. This is a rule of thumb; check theoretical values.
Learn More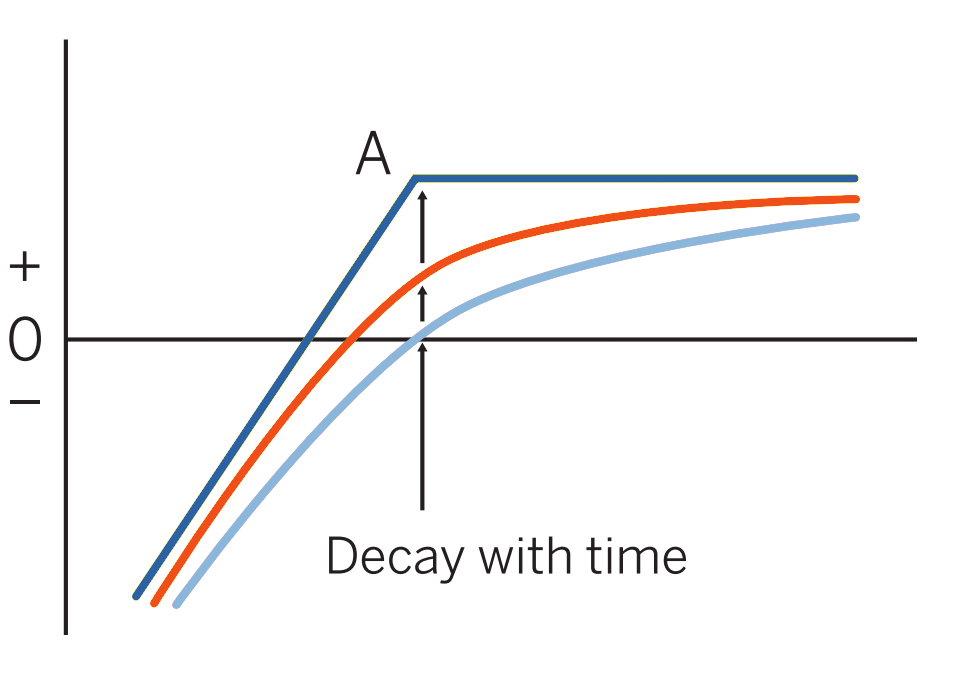
Futures & Options Strategies: Short Put
If you firmly believe the market is not going down. Sell out-of-the-money (lower strike) options if you are only somewhat convinced, sell at-the-money options if you are very confident the market will stagnate or rise. If you doubt market will stagnate and are more bullish, sell in-the-money options for maximum profit.
Learn More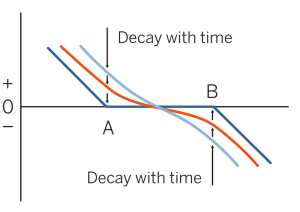
Futures & Options Strategies: Short Risk Reversal
When you are bearish on the market and uncertain about volatility. Normally this position is initiated as a follow-up to another strategy. Its risk/reward is the same as a SHORT FUTURES except that there is a flat area of little or no gain/loss.
Learn More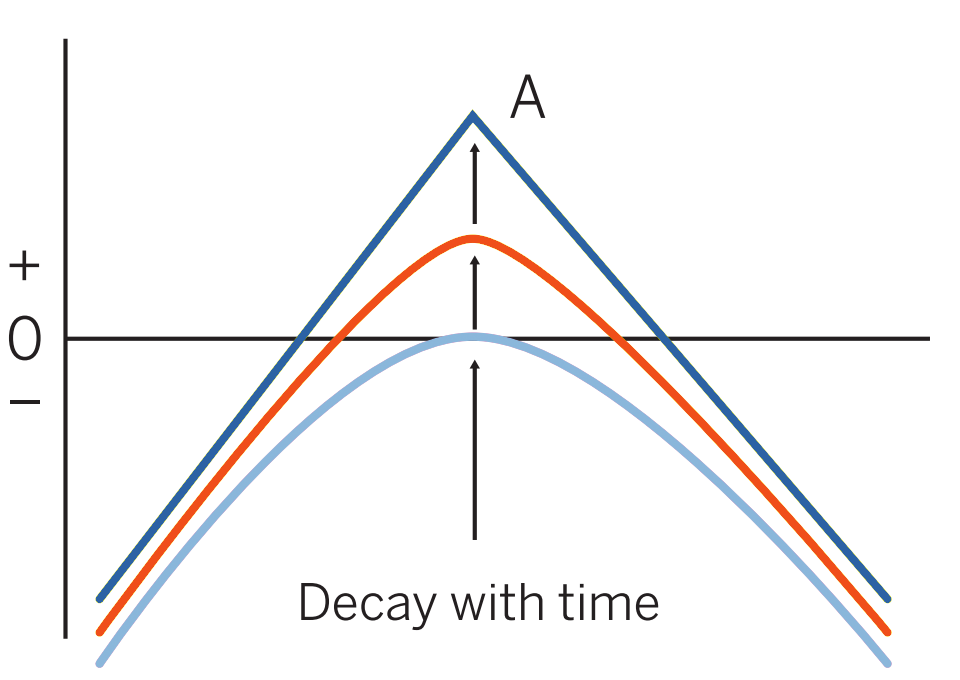
Futures & Options Strategies: Short Straddle
If market is near A and you expect market is stagnating. Because you are short options, you reap profits as they decay — as long as market remains near A.
Learn More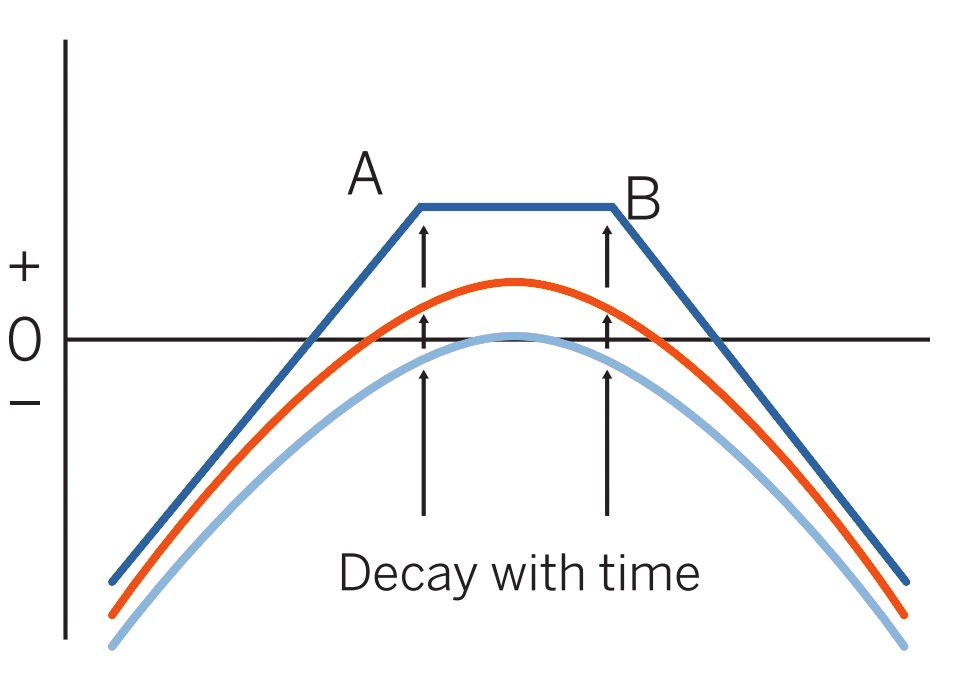
Futures & Options Strategies: Short Strangle
If market is within or near (A-B) range and, though active, is quieting down. If market goes into stagnation, you make money; if it continues to be active, you have a bit less risk then with a short straddle.
Learn More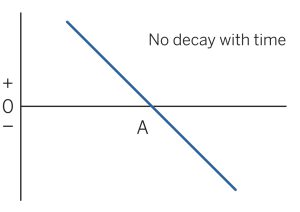
Futures & Options Strategies: Short Synthetic Futures
Short synthetic futures positions may make sense when you are bearish on the market and uncertain about volatility.
Learn More
Futures Trading Glossary
This glossary was compiled by the CME from a number of sources. The definitions are not intended to state or suggest the correct legal significance of any word or phrase. The sole purpose of this compilation is to foster a better understanding of the futures market.
Learn More
Key Market Report Definitions
Definitions of key market reports and their explanations are available to build your knowledge on the markets and trading. Definitions of key areas and reports can be found on our page including; financial/economic, metal market, energy market, grain/oilseed, livestock, softs and weather models.
Learn More
Forward Contract Introduction - Khan Academy Tutorials
This video provides an introduction to forward contracts.
Learn More
Futures Introduction - Khan Academy Tutorials
This video provides an introduction to futures.
Learn More
Motivation for the Futures Exchange - Khan Academy Tutorials
This video discusses motivation for the futures exchange.
Learn More
Backwardation Bullish or Bearish - Khan Academy Tutorials
This video discusses backwardation bullish.
Learn More
Contango from Trader Perspective - Khan Academy Tutorials
This video discusses contango from the trader's perspective.
Learn More
Backwardation - Khan Academy Tutorials
This video discusses backwardation.
Learn More
Contango and Backwardation Review - Khan Academy Tutorials
This video discusses contango and backwardation.
Learn More
Futures and Forward Curves - Khan Academy Tutorials
This video discusses futures and forward curves.
Learn More
Futures Curves II - Khan Academy Tutorials
This video discusses futures curves.
Learn More
Futures Fair Value in the Pre-Market - Khan Academy Tutorials
This video discusses futures fair value in the pre-market.
Learn More
Interpreting Futures Fair Value in the Pre-Market - Khan Academy Tutorials
This video discusses interpreting futures fair value in the premarket.
Learn More
Futures Margin Mechanics - Khan Academy Tutorials
This video discusses futures margin mechanics.
Learn More
Severe Contango Generally Bearish - Khan Academy Tutorials
This video discusses severe contango generally bearish.
Learn More
Upper Bound on Forward Settlement Price - Khan Academy Tutorials
This video discusses upper bound on forward settlement price.
Learn More
Lower Bound on Forward Settlement Price - Khan Academy Tutorials
This video discusses lower bound on forward settlement price.
Learn More
Verifying Hedge with Futures Margin Mechanics - Khan Academy Tutorials
This video discusses verifying hedge with futures margin mechanics
Learn More
Arbitraging Futures Contract - Khan Academy Tutorials
This video discusses arbitraging futures contracts.
Learn More
Arbitraging Futures Contracts II - Khan Academy Tutorials
This video is part two of a series on arbitraging futures contracts.
Learn More
American Call Options - Khan Academy Tutorials
This video discusses American call options.
Learn More
Basic Shorting - Khan Academy Tutorials
This video discusses basic shorting.
Learn More
American Put Options - Khan Academy Tutorials
This video discusses Aerican put options.
Learn More
Call Option as Leverage - Khan Academy Tutorials
This video discusses call option as leverage.
Learn More
Put vs. Short and Leverage - Khan Academy Tutorials
This video discusses put vs. short and leverage.
Learn More
Call Payoff Diagram - Khan Academy Tutorials
This video discusses call payoff diagrams.
Learn More
Put Payoff Diagram - Khan Academy Tutorials
This video discusses put put payoff diagrams.
Learn More
Put as Insurance - Khan Academy Tutorials
This video discusses put as insurance.
Learn More
Put-Call Parity - Khan Academy Tutorials
This video discusses put call parity.
Learn More
Long Straddle Pattern Tutorial - Khan Academy Tutorials
This video describes how to use and profit from the long straddle pattern.
Learn More
Put Writer Payoff Diagrams - Khan Academy Tutorials
This video discusses put writer payoff diagrams.
Learn More
Call Writer Payoff Diagram - Khan Academy Tutorials
This video discusses call writer payoff diagrams.
Learn More
Arbitrage Basics - Khan Academy Tutorials
This video discusses arbitrage basics.
Learn More
Put-Call Parity Arbitrage I - Khan Academy Tutorials
This video discusses put-call parity arbitrage.
Learn More
Put-Call Parity Arbitrage II - Khan Academy Tutorials
This is part two of a series of videos discussing put-call parity arbitrage.
Learn More
Put-Call Parity Clarification - Khan Academy Tutorials
This video discusses put-call parity clarification.
Learn More
Actual Option Quotes - Khan Academy Tutorials
This video discusses actual option quotes.
Learn More
Option Expiration and Price - Khan Academy Tutorials
This video discusses option expiration and price.
Learn More
Futures Markets
Access a variety of free information and resources to help you trade the futures markets. Browse through the list of contracts to find the latest information, including history, contract specifications, market news and more.
Learn More
Australian Dollar Futures
Learn contract specifications and facts about the Australian Dollar.
Learn More
Brazilian Real Futures
Learn contract specifications and facts about Brazilian Real futures.
Learn More
British Pound Futures
Learn contract specifications and facts about British Pound futures.
Learn More
Canadian Dollar Futures
Learn contract specifications and facts about Canadian Dollar. futures
Learn More
Euro FX Futures
Learn contract specifications and facts about Euro futures.
Learn More
Japanese Yen Futures
Learn contract specifications and facts about Japanese Yen futures.
Learn More
Mexican Peso Futures
Learn contract specifications and facts about Mexican Peso futures.
Learn More
New Zealand Dollar Futures
Learn contract specifications and facts about New Zealand Dollar futures.
Learn More
South African Rand Futures
Learn contract specifications and facts about South African Rand futures.
Learn More
Swiss Franc Futures
Learn contract specifications and facts about Swiss Franc futures.
Learn More
U.S. Dollar Index Futures
Learn contract specifications and facts about U.S. Dollar futures.
Learn More
Crude Oil Futures
Learn contract specifications and facts about crude oil futures.
Learn More
Ethanol Futures
Learn contract specifications and facts about ethanol futures.
Learn More
Heating Oil Futures
Learn contract specifications and facts about heating oil futures.
Learn More
Natural Gas Futures
Learn contract specifications and facts about natural gas futures.
Learn More
RBOB Gasoline Futures
Learn contract specifications and facts about RBOB gasoline futures.
Learn More
Canola Futures
Learn contract specifications and facts about canola futures.
Learn More
Corn Futures
Learn contract specifications and facts about corn futures.
Learn More
Rough Rice Futures
Learn contract specifications and facts about rough rice futures.
Learn More
Soybean Futures
Learn contract specifications and facts about soybean futures.
Learn More
Soybean Meal Futures
Learn contract specifications and facts about soybean meal futures.
Learn More
Soybean Oil Futures
Learn contract specifications and facts about soybean oil futures.
Learn More
Wheat Futures
Learn contract specifications and facts about wheat futures.
Learn More
30-Day Federal Funds
Learn contract specifications and facts about 30-day federal funds.
Learn More
Eurodollar Futures
Learn contract specifications and facts about Eurodollar futures.
Learn More
T-Bond Futures
Learn contract specifications and facts about T-Bond futures.
Learn More
T-Note Futures
Learn contract specifications and facts about T-Note futures.
Learn More
Feeder Cattle Futures
Learn contract specifications and facts about feeder cattle futures.
Learn More
Lean Hog Futures
Learn contract specifications and facts about lean hog futures.
Learn More
Live Cattle Futures
Learn contract specifications and facts about live cattle futures.
Learn More
Milk Futures
Learn contract specifications and facts about milk futures.
Learn More
Copper Futures
Learn contract specifications and facts about copper futures.
Learn More
Gold Futures
Learn contract specifications and facts about gold futures.
Learn More
Palladium Futures
Learn contract specifications and facts about palladium futures.
Learn More
Platinum Futures
Learn contract specifications and facts about platinum futures.
Learn More
Silver Futures
Learn contract specifications and facts about silver futures.
Learn More
CRB CCI Index Futures
Learn contract specifications and facts about CRB CCI Index futures.
Learn More
DJIA Futures
Learn contract specifications and facts about DJIA futures.
Learn More
NASDAQ 100 Futures
Learn contract specifications and facts about NASDAQ 100 futures.
Learn More
Russell 2000 Futures
Learn contract specifications and facts about Russell 2000 futures.
Learn More
S&P 500 Index Futures
Learn contract specifications and facts about S&P 500 futures.
Learn More
Cocoa Futures
Learn contract specifications and facts about cocoa futures.
Learn More
Coffee Futures
Learn contract specifications and facts about coffee futures.
Learn More
Cotton Futures
Learn contract specifications and facts about cotton futures.
Learn More
Lumber Futures
Learn contract specifications and facts about lumber futures.
Learn More
Orange Juice Futures
Learn contract specifications and facts about orange juice futures.
Learn More
Sugar Futures
Learn contract specifications and facts about sugar futures.
Learn More
Technical Analysis Learning Center
Our futures chart technical analysis learning center comes with numerous studies. Default parameters for each study are shown below, the user can change the parameters for the study after it has been applied to the chart.
Learn More
Bollinger Bands
Bollinger Bands consist of a Moving Average and two standard deviations charted as one line above and one line below the Moving Average. The line above is two standard deviations added to the Moving Average. The line below is two standard deviations subtracted from the Moving Average.
Learn More
Envelope
Envelopes represent bands that are plotted in a certain, identical relationship above and below the Moving Average. Envelopes are a very complex theme with many interpretation and trading rules. Basically, envelopes capture a significant part of price movements.
Learn More
Commodity Channel Index
Commodity Channel Index is designed to detect beginning and ending market trends. This study measures the distance between the share prices and their Moving Average, and thus allows a measurement for the trend strength and/or intensity
Learn More
Crack Spread
The CRACK spread study is a futures transaction that parallels the process of refining Light Crude Oil (CL) into petroleum products, such as Heating Oil (HO) and Unleaded Gas (HU). Since the refining process involves “cracking” crude oil into its major components, the spread is referred to as a crack.
Learn More
Crush Spread
The CRUSH spread study is a futures transaction that parallels the process of producing bean oil (BO) and soymeal (SM) from soybeans (S). This study will only work with S, BO, and SM contracts on a daily chart.
Learn More
Default
Each study has its own set of properties which may be modified. Certain studies (such as Bollinger Bands, Exponential Moving Average, and Momentum), perform their calculations using a specific value (Field) from the underlying data on which the study is applied. When the study is initially applied to a chart, it “binds” itself to this Field, which is set in the study properties.
Learn More
Directional Movement Index
The concept of Directional Movement is based on the assumption that in an upward trend today’s highest price is higher than yesterday’s highest price, and in a downward trend today’s lowest price is lower than yesterday’s lowest price.
Learn More
Exponential Moving Average
The Exponential Moving Average gives the recent prices an equal weighting to the historic ones. The calculation does not refer to a fixed period, but rather takes all available data series into account. This is achieved by subtracting yesterday’s Exponential Moving Average from today’s price.
Learn More
Exponential Oscillator
The Exponential Oscillator is plotted as a histogram, using the difference between two Moving Averages. It can be used to help identify divergences, short-term variations from the long-term trend, and to identify the crossing of two Moving Averages, which occur when the oscillator crosses the zero line.
Learn More
High Low Moving Average
The High Low Moving Average study allows you to quickly and easily compute a simple moving average of the high and low for the interval. The length of the moving average may vary for the high and low.
Learn More
Highest High / Lowest Low
The mathematics defines an envelope of values by using the Highest High or the Lowest Low of the Last ‘n’ Periods.
Learn More
Historic Volatility
Although traders cannot predict the future, they must make intelligent guesses as to what the future holds. A standard approach used in option evaluation is to look at the past. What has historically been the volatility of a certain commodity?
Learn More
Keltner Channel
This moving average system by Chester W. Keltner consists of an n-day moving average of the “typical price” (sometimes referred to as “average price,” ((H+L+C)/3), plotted with a channel formed by adding and subtracting an n-bar moving average of the high-low range to or from the moving average of the typical price. Thus, the width of the channel adjusts to market volatility.
Learn More
Least Squares Linear Regression
The Least Squares Linear Regression line indicates the dominant market trend relative to time. In simple terms, is the market trending lower or higher with respect to time? It can inform you when the market is diverging from an established trend, but only when prices fluctuate uniformly around the trendline and within a narrow range.
Learn More
Line Oscillator
This study is a combination of two different studies. The first set of calculations compute a simple oscillator. The second part computes a simple moving average of the oscillator. You must specify two values for the moving averages to calculate the oscillator. Next, a third value is specified for a moving average of the oscillator. The application computes the values and displays two lines on the chart.
Learn More
Momentum
Momentum is an oscillator-type study used to interpret overbought/oversold markets. It assists in determining the pace at which price is rising or falling. This indicates whether a current trend is gaining or losing momentum, whether or not it is overbought or oversold, and whether the trend is slowing down.
Learn More
Moving Average
Moving Average is generally used to identify or confirm a trend, and works best in trending markets. It will not signal you that a trend change is imminent, but it will help you to determine if an existing trend is still in motion and help you to confirm when a trend reversal has taken place.
Learn More
Moving Average Convergence Divergence
The MACD is both a trend follower and an oscillator. The abbreviation stands for Moving Average Convergence Divergence. It is the difference between a fast Exponential Moving Average (EMA) and a slow Exponential Moving Average.
Learn More
Moving Standard Deviation
Moving Standard Deviation is a statistical measurement of market volatility. It makes no predictions of market direction, but it may serve as a confirming indicator. You specify the number of periods to use, and the study computes the standard deviation of prices from the moving average of the prices.
Learn More
Open Interest
Open Interest shows the number of open contracts of a given option or futures contract. An open contract can be a long or short contract that has not been exercised, closed out, or allowed to expire.
Learn More
Oscillator
The oscillator can be used to help identify divergences, short-term variations from the long-term trend, and to identify the crossing of two Moving Averages, which occur when the oscillator crosses the zero line.
Learn More
Parabolic Stop and Reversal
The Parabolic Stop and Reversal is a simple study to use. The study continuously computes “stop and reverse” price points. Whenever the market penetrates this “stop and reverse” point, you liquidate your current position and take the opposite position. If long, you liquidate the long position and establish a short position. If short, you liquidate the short position and establish a long position.
Learn More
Rate of Change
The Price Rate of Change study is first calculated by dividing the price change over the last ‘n’ periods by the closing price of the instrument ‘n’ periods ago. The result is the percentage by which the price has changed over the last ‘n’ periods.
Learn More
Relative Strength Index
The Relative Strength Index, developed by Welles Wilder is a special form of the Momentum and probably the most widely used contra-trend-oscillator. Contrary to the implications of its name, the study does not show the instrument’s strength in comparison to other instruments, but rather the instrument’s internal strength compared to its former prices.
Learn More
Smoothed Moving Average
A Smoothed Moving Average is an Exponential Moving Average, only with a longer period applied. The Smoothed Moving Average gives the recent prices an equal weighting to the historic ones. The calculation does not refer to a fixed period, but rather takes all available data series into account.
Learn More
Smoothed Oscillator
A Smoothed Oscillator is an Exponential Oscillator, only with a longer period applied. The Smoothed Oscillator is plotted as a histogram, using the difference between two Moving Averages. It can be used to help identify divergences, short-term variations from the long-term trend, and to identify the crossing of two Moving Averages, which occur when the oscillator crosses the zero line.
Learn More
Stochastic
The Stochastic Study, developed by George Lane, is an oscillator that compares the difference between the closing trade price of an instrument and the period low, relative to the trading range over an observation time period. With the help of this study, the position of the price quotation within the prevailing fluctuation margins is quantified.
Learn More
Slow Stochastic Oscillator
When it comes to understanding the trending market, the Slow Stochastic Oscillator is a helpful component of any trading strategy. The oscillator works by comparing the difference between the closing trade price of an instrument and the period low relative to the trading range over an observation time period.
Learn More
Variable Moving Average
The Variable Moving Average study allows you to get very creative with the moving averages. Three moving averages are applied (normal, exponential, and smoothed).
Learn More
Volume
Volume displays the volume of an instrument. It can be plotted as a line-chart or a histogram. It is not currently applicable for Intraday charts and will never be applicable for Tick charts, due to the nature of the data.
Learn More
Volume and Open Interest
Volume and Open Interest can be a barometer of future activity and direction. Volume measures the number of contracts that exchanged hands during the trading session. It measures market activity. Open Interest is the total number of outstanding contracts. It gauges market participation.
Learn More
Weighted Close
The Weighted Close study is another way of viewing the price data. It is an average of each day’s price, placing a greater emphasis on the closing price rather than the high or low. This process creates a single line chart.
Learn More
Williams’ %R
The Williams’ %R is designed to show the difference between the period high and today’s closing price with the trading range of the specified period. The study, therefore, shows the relative situation of the closing price within the observation period.
Learn More
Basic Training for Futures Traders
Get futures trading training tips and tricks from experienced futures trading brokers.
Learn More
Futures & Options Strategy Guide
Learn 25 futures and options trading strategies in this easy-to-read guide.
Learn More
Introduction to E-mini Stock Index Futures
This guide covers the S&P 500, Dow Jones Industrial Average, and the NASDAQ Composite, as well as discussing tips and strategies for trading them.
Learn More
Gold Products Overview Course
This comprehensive CME Group lesson will teach you the importance of paying attention to current economic and political events in the U.S. when trading gold, how gold is used as a hedge for non-U.S. economics, why gold is often viewed as a “safe” commodity during times of economic hardship, and more!
Learn More
Futures Trading: Technical Analysis for Beginners
Get helpful advice on technical analysis for futures traders in this e-book.
Learn More
Introduction to Oil Futures
Our free eBook covers essential topics like top reasons for participating in crude oil futures, crude contract specifications, fundamental market considerations, and more!
Learn More
Course: Futures vs. ETFs
This course explains the differences between futures and exchange-traded funds, why they’re popular among investors, and the advantages and disadvantages of each.
Learn More
Webinar: The Future of Sustainable Investing
Index product experts explain the importance of sustainable investing and why it matters for the future.
Learn More
Course: Things to Know Before Trading CME Group Futures
Trading futures is different from trading stocks or exchange-traded funds. This kind of trading tends to work best in markets that are especially liquid. CME Group's in-depth course will explore various aspects of trading futures contracts.
Learn More
Course: Options Strategies
Options strategies are an important aspect of any trader’s portfolio. Learn more about how these trading techniques can be used when responding to market direction and expected volatility in CME Group’s “Options Strategies” course.
Learn More
Course: Trading Psychology
One of the most daunting obstacles you’ll face when becoming a futures trader can be learning how to master your own mind. Why? Your success is largely dependent on the ability to learn from failure—and no one likes to fail.
Learn More
Course: Futures vs. ETFs
When it comes to futures versus ETFs, both are used to diversify investor portfolios, but does one offer more advantages than the other? This course explains the differences between futures and exchange-traded funds, why they’re popular among investors, and the advantages and disadvantages of each.
Learn More
Webinar: Getting Started with Micro Bitcoin Futures
Delve into the world of Bitcoin with this online webinar, Getting Started with Micro Bitcoin Futures. With a value of one-tenth of a single Bitcoin, Micro Bitcoin future contracts provide investors with economical ways to maximize Bitcoin exposure and optimize their cryptocurrency strategies.
Learn More
Course: An Introduction to Crude Oil
Familiarize yourself with today’s vast global crude oil market in this Introduction to Crude Oil course. Explore the fundamentals of modern energy markets, which can have a significant impact on many of the world’s leading economies.
Learn More
Course: Introduction to Options
As an important part of any successful trader’s technical arsenal, options can be used to predict volatility, market direction, hedge positions, and more. This comprehensive course from CME Group will help traders of any experience level learn more about options, exploring subjects such as contract details, theoretical pricing, expiration dates, and intrinsic value.
Learn More
Course: Gold Products Overview
One of the most widely traded commodities across the globe, gold futures products can be used to diversify trader portfolios and mitigate risk. Viewed as a “safe haven” during periods of economic uncertainty or political upheaval, gold futures prices often move inverse to the U.S. dollar, treasury bonds, and stock indexes.
Learn More
Course: Silver Products Overview
A useful tool that can serve as an inflation hedge, silver is the most widely used precious metal in history and has been mined for thousands of years. Historically used as currency, silver shares many of the “safe haven” characteristics of gold.
Learn More
Webinar: Trading Crude Oil and Natural Gas Options
Energy markets carry a large percentage of today’s global economies, influencing nearly every nation in some way. Futures and options on crude oil, refined products, natural gas, power, and coal help investors of any experience level mitigate risk and maximize the potential of these resources.
Learn More
Course: Key Economic Events
A variety of factors can impact the market, especially key economic events that can shift prices up or down. These economic factors can include changes in sales or commodity consumption, shortages, supply and demand, releases made by certain government entities, and more.
Learn More
Course: Introduction to Bitcoin
Dive into the world of Bitcoin with this comprehensive online course. Created in 2009, Bitcoin is a type of decentralized cryptocurrency that can be transferred from one party to another without the need for intermediation from a central authority.
Learn MoreSorry! There weren't any results for that filter, please try something different