
Overview
Pattern evolution


When to use
If you think the market will go up, but with limited upside. Good position if you want to be in the market but are less confident of bullish expectations. You’re in good company. This is the most popular bullish trade.
Profit characteristics
Profit limited, reaching maximum if market ends at or above strike price B at expiration. If call-vs.- call version (most common) used, break-even is at A + net cost of spread. If put-vs.-put version used, break-even is at B – net premium collected.
Loss characteristics
What is gained by limiting profit potential is mainly a limit to loss if you guessed wrong on market. Maximum loss if market at expiration is at or below A. With call-vs.-call version, maximum loss is net cost of spread.
Decay characteristics
If market is midway between A and B, little if any time decay effect. If market is closer to B, time decay is generally a benefit. If market is closer to A, time decay is generally detrimental to profitability.
Category
Directional
Long call A, short call B
Long put A, short put B
Example
Scenario
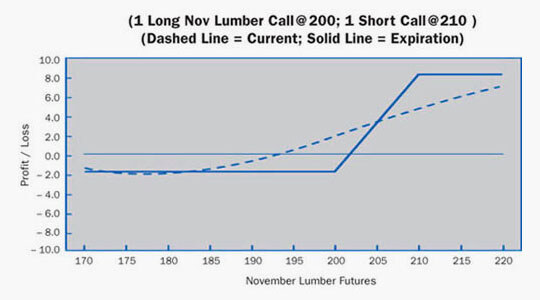
The trader feels bullish on Lumber, but volatility is in question. He could try futures as an alternative, but wants the comfort of a limited loss position. He decides on a bull spread with the higher strike written at the top of his expected trading range of 210.
Specifics
Underlying Futures Contract: November Lumber
Futures Price Level: 193.00
Days to Futures Expiration: 60
Days to Options Expiration: 40
Option Implied Volatility: 18.6%
Option Position:
| Long 1 Nov 200 Call | – 2.10 ($315) |
| Short 1 Nov 210 Call | + 0.50 ($ 75) |
| – 1.60 ($240) |
At Expiration
Breakeven: 201.60 (200.00 strike + 1.60 debit)
Loss Risk: Limited to premium paid. Losses increase below 201.60 to a maximum loss below 200.00 of 1.60 ($240).
Potential Gain: Limited to difference between strikes less debit paid (10.00 – 1.60) 8.40 ($12,600). Gains mount above 201.60 with maximum profit at 210.00.
Things to Watch
Volatility changes affect this spread very little. Therefore, if the trader has an opinion on volatility, one of the other strategies may work better. Check the next page for follow-up strategies.
